There are lots of data floating around about Internet user statistics
whether in the US or worldwide. Such data are very hard to come by if you
need them for rigorous statistical analyses (as opposed to a bulletpoint
in a short little piece). I've decided to post some of my figures from
related research because such information can be useful to many yet are
not widely available. Although the National Telecommunications
and Information Administration provides lots of related figures, they
are
a bit hard to read. In particular, the 2002 report "A Nation
Online" has some useful over time graphs but not always legible
(granted, the core statistics are featured on the bottom of the Chapter 2
page so you could create your own graphs if you wanted to).
The difference here is that I present figures for the adult population
only (the NTIA site includes data for all those three years of age and
above). One of the reasons I restrict my sample to those 18 and above is
because other data sets I use (like the General
Social Survey) only include adults in their samples and so it's
important for consistency in my work.
I post these figures under the Creative Commons
Attribution-NoDerivs-NonCommercial 1.0 License which
means that you may use these figures elsewhere with attribution, for
non-commercial purposes. If you do, I'd appreciate it if you let me
know
(eszter
at
princeton
dot edu). If you'd like to use them for commercial
purposes, please contact me.
A few notes about the data. The Current Population Survey has added
computer use questions to some of its surveys since November, 1994. The
Nov, 1994 survey was quite different from the others and thus comparison
is a bit tricky. All survey documentation and the raw data are available
on the Census' Web site. A
separate page has links to the Computer
and Internet Use Supplements directly. The 2002 report has a list of
relevant disclaimers/notes about the data in the footnotes to Chapter 2.
Click here for a paper
that
discusses
these figures and features a few others as well with international
data.
Click here for a list of
my related
publications (including full copies online).
And now on to the graphs.
Jump to: Overall |
Gender |
Race |
Ethnicity |
Income |
Education |
Urban |
Region
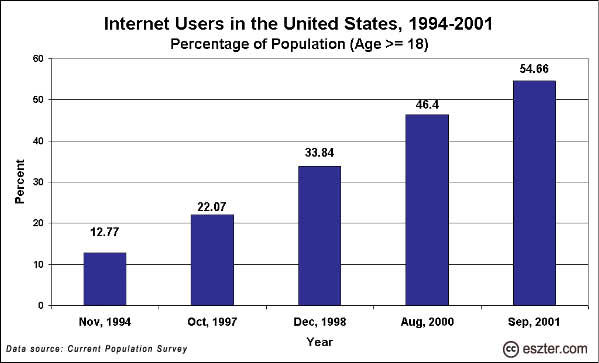
This image above shows the percentage of the adult US population online
in the respective years.
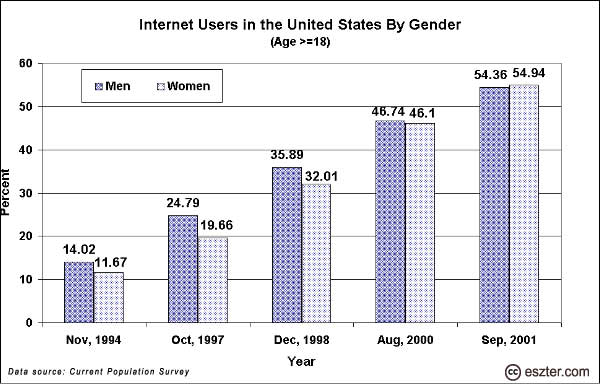
This image shows the percentage of men and women online among the
adult US population.
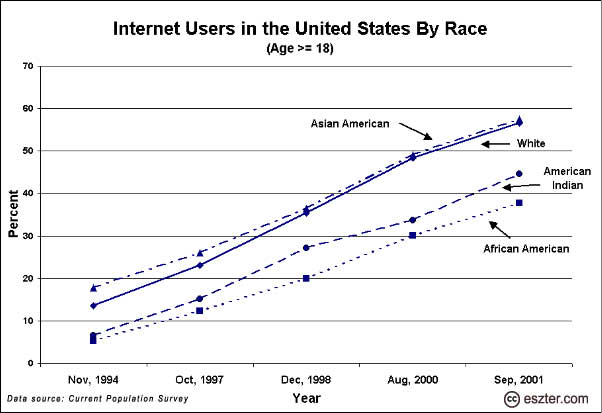
This image shows the percentage of racial groups online among the
adult US population.
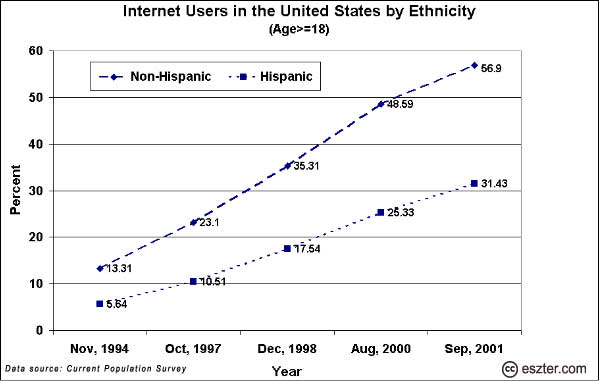
This image shows the percentage of non-Hispanic and Hispanic groups
online among the adult US population.
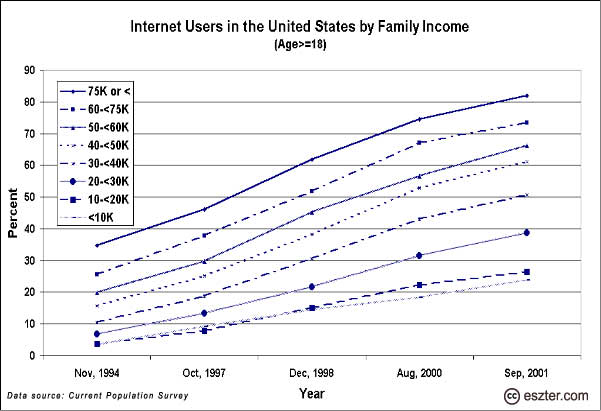
This image shows the percentage of groups with different income
online among the adult US population.

This image shows the percentage of groups with different educational
attainment online among the adult US population.
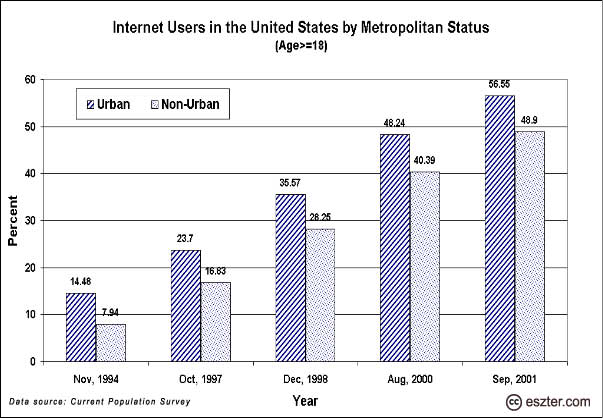
This image shows the percentage of urban and non-urban groups
online among the adult US population.
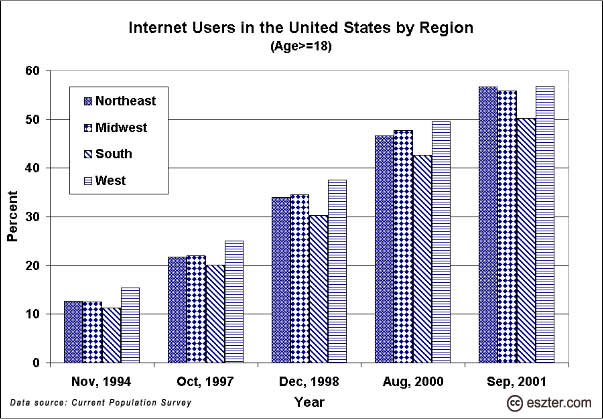
This image shows the percentage of groups by geographic area
online among the adult US population.
Go to Eszter's Research Page
Go to Eszter.com entry page
Go to Eszter's Blog
|